
About this template
Kick off the year with this fun activity. Poll students on favorites and graph the results live to build community and get to know your class.
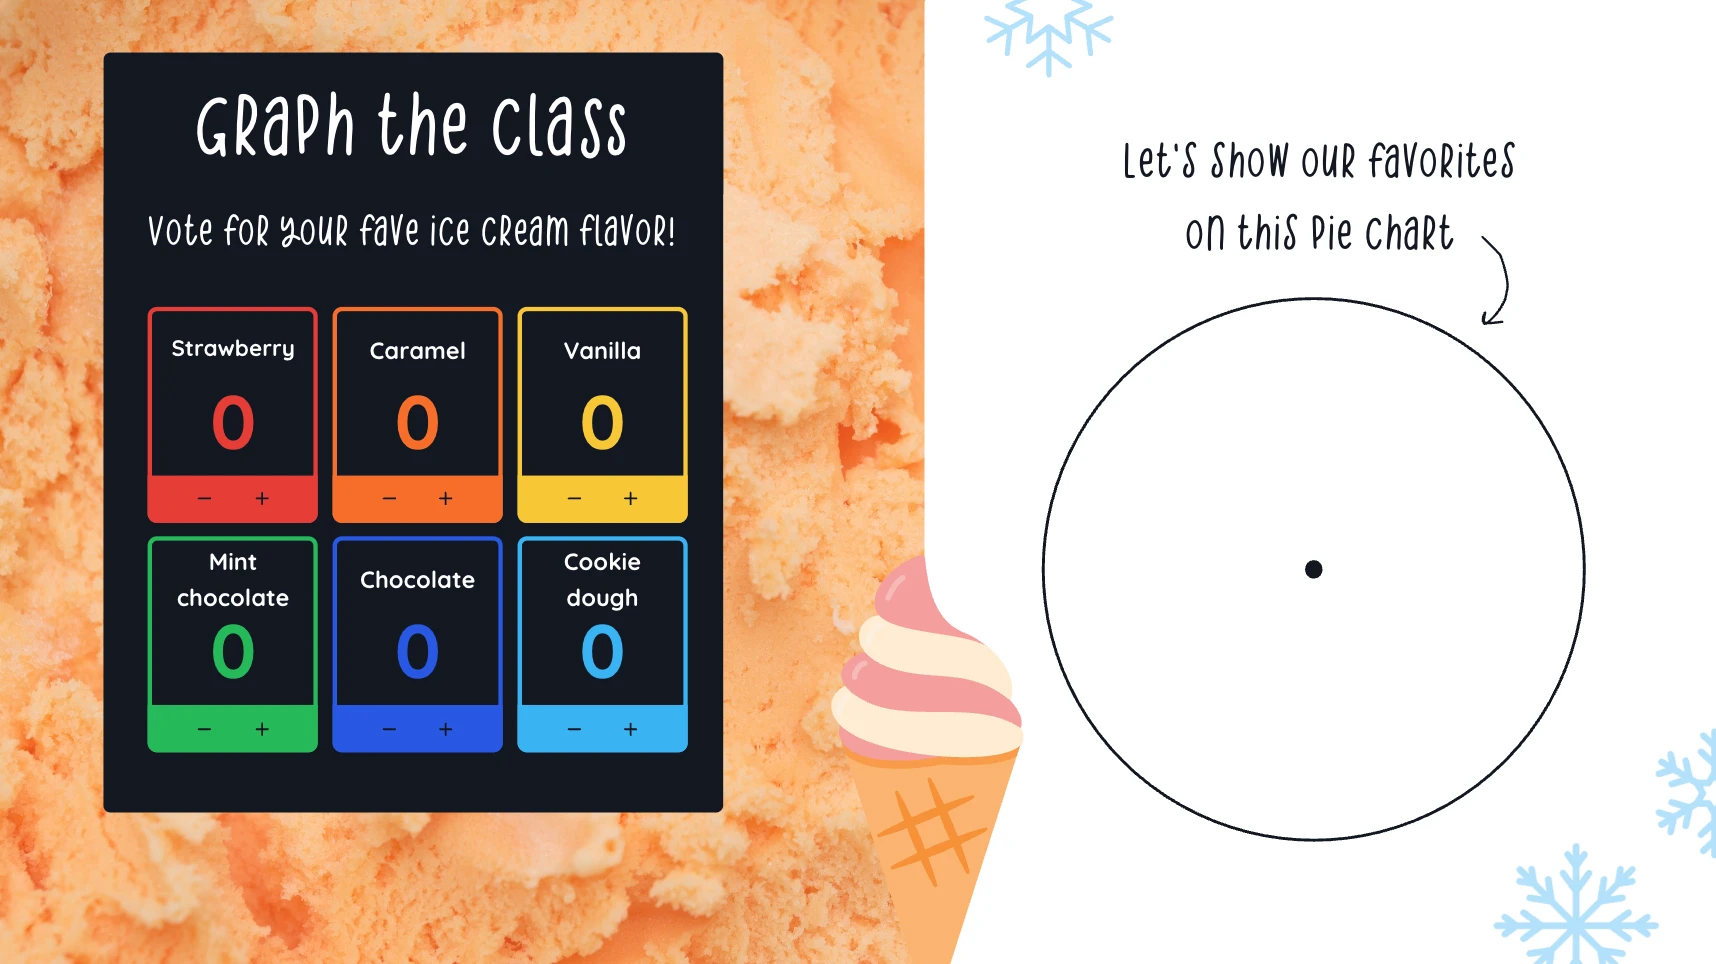
Image 1
Image 2
Image 3
How it works
There are two screens - one for making pie charts, one for making bar charts. Students answer the question on the Poll widget, then collectively as a class, you can convert the results to a different style of graph.
This visual activity helps everyone learn about classmates in a lively, interactive way while building comfort with sharing and data skills.
tip:
You can change the questions through the Poll widget settings.


